Obama’s is the Worst Economic Recovery in History (Graph, GDP Data)
Posted by FactReal on February 16, 2013
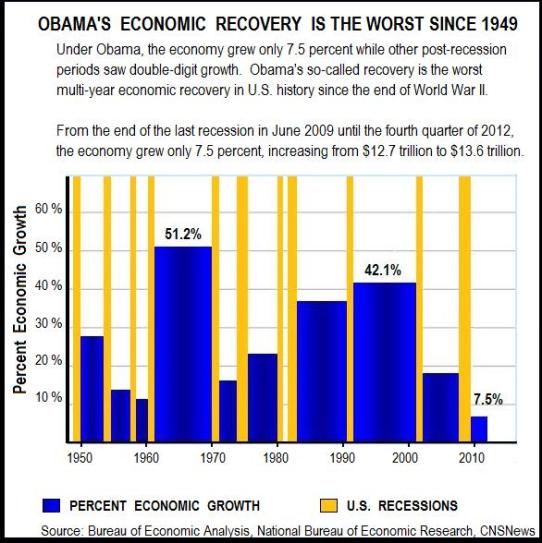
| “Obama has presided over the worst multi-year recovery in American history since the end of World War II,” CNSNews found using public economic data. During Obama’s so-called economic recovery, the economy grew only 7.5% while other post-recession periods saw double-digit growth from 11.7% to 51.2%.
“From the end of the last recession in June 2009 until the fourth quarter of 2012, the economy grew only 7.5 percent, increasing from $12.7 trillion to $13.6 trillion,” explains CNSNews.
We prepared graphs and tables to illustrate how weak Obama’s economic recovery has been.
(Sources: Gross Domestic Product (GDP) since 1949 and NBER’s List of U.S. Recessions.) |
 |
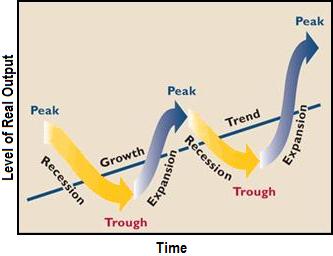
| RECESSION PERIODS (A recession/contraction is a period between a peak and a trough — see graph below.)
Officially, the last recession lasted from December 2007 to June 2009.
|
| |||||||||||||||||||||||||||||||||||||||
| RECOVERY/POST-RECESSION PERIODS (An expansion is a period between a trough and a peak — see graph below.)
Obama’s economic recovery is the worst multi-year recovery when compared with double-digit growth in other post-recession periods.
During Obama’s economic recovery (from the second quarter of 2009 until the fourth quarter of 2012), the economy grew only 7.5 percent, increasing from $12.7 trillion to $13.6 trillion.
|
| |||||||||||||||||||||||||||||||||||||||||||||||||||||||||||||||||||||||||||||
 |
| NOTE The early 1980s post-recession period lasted just 12 months (from July 1980 to July 1981.)
National Bureau of Economic Research
●http://www.nber.org/cycles/cyclesmain.html
Bureau of Economic Analysis
●http://www.bea.gov/iTable/iTable.cfm?ReqID=9&step=1#reqid=9&step=1&isuri=1 |


No comments:
Post a Comment